Alder Lake Deep DiveMaking ADL Power Efficient & DDR5 Overclocks

Introduction
On November 17th I released my Alder Lake-S Review which including a deep dive into the 12th Gen Alder Lake architecture. I have had roughly a week since then to learn more about the architecture and play around with various settings in the UEFI\BIOS. There are tons of settings in the UEFI menu and that should keep enthusiast busy for a while. I wanted to overclock my i9-12900K, but I am currently waiting on my LGA1700 brackets for my EK-360mm radiator AIO. I am currently using the LGA1200 brackets and I want to be sure that I am getting the best CPU temperatures possible before I begin to push the CPU to its limits. In the meantime I wanted to expand on my previous findings in the previous Alder Lake article to see how efficient I could make Alder Lake. During this time I also wanted to explore overclocking the DDR5 RAM and possibly lower my DRAM latency. In this article I will provide the results of my findings. For those who want more information please be sure to check out my initial article on Intel’s 12th Generation Alder Lake micro-architecture. In this article we will be taking another deep dive to see how efficient I can make the i9-12900K.
Specifications

CPU: Intel Core i9-12900K
CPU Cooler: EK AIO 360mm Liquid Cooler
Motherboard: ASUS ROG Strix Z690-F Gaming Wi-Fi
RAM: 32GB DDR5-4800Mhz [2x16GB]
PSU: Phanteks 1200W - 80+ Platinum
SSD: 1TB WD BLACK SN850 - 7.0GB\s Read - 5.3GB\s Write - PCIe Gen4 (x4)
SSD: 3TB - 2.7GB\s Read - 2.1GB\s Write
HDD: 6TB - 350MB Read - 330MB\s Write - RAID 0
GPU: EVGA RTX 3080 Ultra Liquid Cooled 240mm - Push
GPU Speed: 1440Mhz
(Stock) –
Core: Mhz (Mhz Boost) - 1845Mhz
GPU vRAM: 10GB
GPU Drivers: Geforce: v496.76 [Dec. 1st, 2021]
Operating System: Windows 11
Making Alder Lake Efficient & DDR5 Overclocks YouTube Video
Direct Link to Youtube Video - https://www.youtube.com/watch?v=JDwqTpT0nIc
Undervolting & OverclockingAlder Lake's Atom Cores
CPU Power Consumption
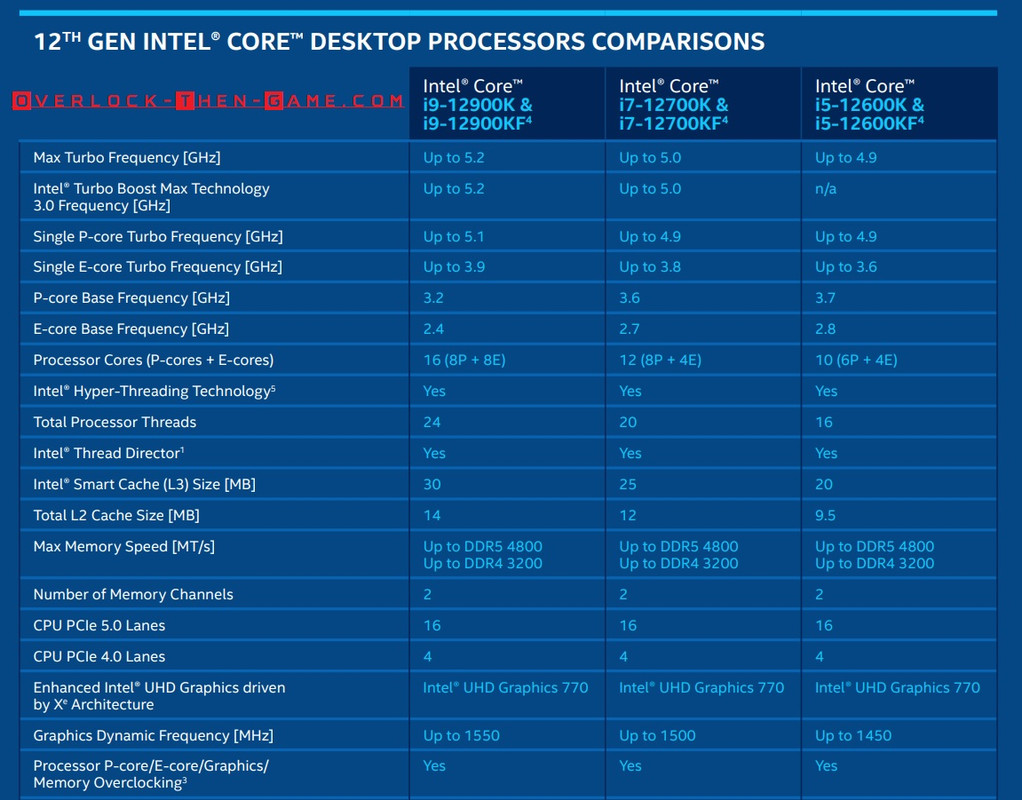
Starting with Alder Lake’s voltage, the i9-12900K default average is 1.26v. In my first review I was able to undervolt the i9-12900K to 1.16v, but I have taken it even further and lowered my vCore to 1.11v. The Performance Cores continued to use their default settings which are 4.9GHz for all cores when 5 or more P-Cores are being utilized, 5.0GHz when 3 or 4 P-Cores are being utilized, 5.1GHz for 2 P-Cores and 5.2GHz when 1 P-Core is being used. The Efficient Cores default frequency is 3.7GHz when all 5 or more E-Cores are being utilized and 3.9GHz when 4 or less E-Cores are being used. I was able to overclock all eight of the E-Cores up to 4.0GHz while under-volting the CPU. As I stated earlier the P-Cores running their default settings, I settled on 1.17v for this portion of the tests. I also tweaked other voltage settings to limit how much voltage the i9-12900K needed. Intel has including many features that can dictate and allow the CPU to run at higher frequencies depending on the voltage, wattage, temperatures and so on. My goal was to limit these features as much as possible in order to keep the CPU wattage\voltage and temps as low as possible. My other goal is to see if I can keep the same performance while lowering my overall power consumption from the wall outlet. Lowering the voltage should naturally or potentially lower other various voltages across the micro-architecture.

Here we see the differences between the stock i9-12900K results against my undervolted i9-12900K with the P-Cores using stock settings, but the E-Cores overclocked to 4GHz. I was able to drop the voltage, temps and CPU wattage. I used Cinebench R23 in this power usage test. While using the 1.17v settings the CPU Package reported 191watts on average which is a 33 watt drop from the stock wattage (224watts) and that’s with 8 overclocked Efficient Cores. I was able to drop the temps by 9 Celsius. While using the 1.11v settings I was able to decrease the CPU wattage by 40 watts below the stock voltages and drop the CPU temperature by 13 Celsius. I am currently using the LGA1200 (Rocket Lake) brackets while I am waiting for my LGA1700 (Alder Lake) bracket to be shipped. Luckily my motherboard supports both mounting brackets. It is possible that I can gain better temperatures so I will need to re-test in the future. I have completed a few more benchmarks to show my performance.
Platform Power Consumption
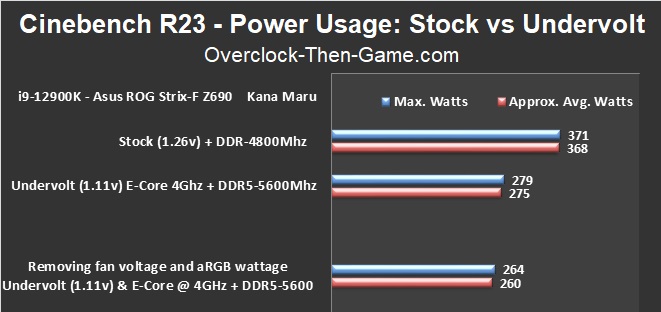
Now we will take a look at the wattage that the entire PC is pulling from the wall outlet. I have including the original stock wattage in my initial Alder Lake-S review. In order to keep the results apple’s to apple’s this result only includes the CPU, RAM, motherboard, and fans; so I removed the GPU for this specific power consumption benchmark. Although the GPU barely pulls wattage when Idle I wanted to make my calculations for the aRGB fan wattage easier. After undervolting Alder Lake-S we see a decrease of 93 watts. That is 25% less wattage being pulled from the wall. So far Alder-Lake is already appearing to be very efficient based on my undervolting. Earlier I spoke about the aRGB fan wattage. My tests show that the aRGB fans running at full speed adds a total of approximately 15 watts to the total system power consumption. At the bottom of the chart I subtracted the aRGB fan wattage to show the power consumption for only the CPU, RAM and motherboard. The comes out to approx. 260 watts. I will update my original Alder Lake-S Review as well for those who might want to know how much wattage the Alde Lake-S CPU + Z690 + Motherboard pulls without the RGB fans wattage or the GPU.
Cinebench R23 Stock vs Overclocked - E-Cores
The results below will include my Efficient Cores overclocked to 4GHz, DDR5-4800Mhz with stock timings (40-39-39-76), the i9-12900K undervolted to 1.17v with the Performance Cores running default settings. Later in the article we will take a look at the 1.11v
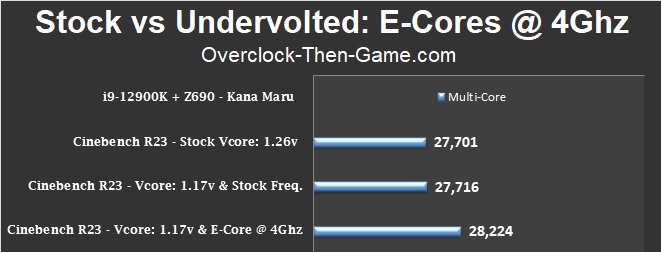
Above I have included 3 results that show several configurations for my CPU. All three results are using DDR5-4800Mhz with stock timings. The first result shows the stock (voltage & frequency) i9-12900K (1.26v), the second result show the stock frequency i9-12900K with lower voltage (1.17v), the third results shows the 12900K with lower voltage (1.17v) and the Efficient Cores overclocked to 4Ghz (P-Cores are using their stock frequency). The first two results are within the margin of error so that’s great because there doesn't appear to be any performance loss. The last result shows how 300MHz over the stock E-Cores (3.7GHz) practically gives you free performance with the lower voltage & wattage. I was able to increase my Cinebench score by 523 points. So far this is great news for me especially since I won’t be running my CPU at 100%. Lower overall wattage, more performance and lower temps will always be a great thing.
y-cruncher v0.7.8 (Build 9507) - Stock vs Overclocked - E-Cores
Next we see that when we are crunching through 1 billion decimals in y-cruncher I was able to complete the benchmark 318 milliseconds quicker. So the overclocked E-Cores are showing some differences across various benchmarks. Although the differences between the y-cruncher results might seem minor you must remember that this is practically free performance sitting on the table at lower voltage and wattage usage.

Undervolting & Overclocking4GHz E-Core Deep Dive
‘Gracemont’ Efficient Cores @ 4Ghz Latency Deep-Dive
Now we will take a look at the micro-architecture performance of the Efficient Cores when overclocked from 3.7GHz to 4GHz. The Performance Cores will perform roughly the same since I have not overclocked them. Therefore I will not test them at the moment, but later in the article I will benchmark the Performance Cores when I overclock the DDR5 RAM. As a reminder the results below are using the DDR5 RAM with stock frequency and timings. (DDR5-4800Mhz - CAS 40) All of the benchmarks so far in this article have used the default DDR5 frequency.

Looking at the data we will start with the L3 Cache. Nearly all of the Efficient Cores show lower latencies as expected. Four of the eight slowest cores (#17, #19, #21 & #23) all show lower latencies which should allow better throughput. Core #23 shows the largest drop of -1.8ns drop which is great. Lower is always better when it comes to latency. The L3 Cache latency average improved from 14ns to 13ns for all cores during my testing. The L2 Cache latency has improved across the board by 4%. It sounds minor, but it can be major when it comes to data and bandwidth across 2 clusters or 8 E-Cores. L1 Cache reports the same latency which is fine since L1 Cache is always the fastest by design.
All 8 Efficient Cores @ 4Ghz vs Stock (3.7Ghz) Results
Now we will look at various workloads while running the E-Cores at 4.0GHz. The final results will show how much data can pass through both Clusters when they are working together. As a reminder there are x2 Clusters and each cluster contains 4 Efficient “Atom” Cores.

How much can a small 300Mhz bump increase improve the Efficient Core performance while dropping the CPU Package wattage by 33 watts(1.17v) up to 40 watts(1.11v)? The answer is an extra 11.5 GB\s in performance. In my original article using only the 8 E-Cores (3.7GHz) I average 175.55 GB\s across several workloads and now I am averaging 187.09 GB\s with the E-Cores overclocked to 4GHz. Now we can start to understand how the Cinebench showed an extra 523 points when overclocking the E-Cores to 4Ghz and how y-cruncher was able to complete the 1 Billion Decimal benchmark quicker.
Efficient Clusters @ 4Ghz vs Stock (3.7Ghz) Results
Now I will follow the same methodology as I did in my first article and separate the E-Core Cluster results. The results below will show how well each Cluster (8 E-Cores) work independently on data without transferring data to the opposite cluster or Performance Cores.
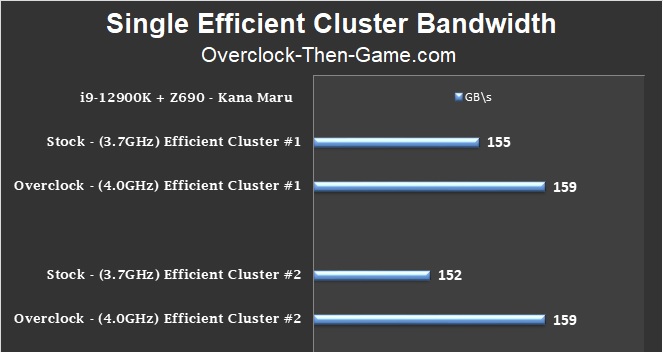
Cluster #1 increased by 4GB\s while Cluster #2 increase by 7 GB\s. Cluster #1 total shows 158.7 GB\s and Cluster #2 showed 158.92GB\s. They are now more or less equal in performance. This means that if Intel’s Thread Director and Microsoft’s Windows 11 scheduler ensures that certain workloads can stay within the cluster we could see up to 318 GB\s from the Efficient Cores. In my initial Alder Lake-S Review article we saw that the both Efficient Clusters could theoretically allow up to 307 GB\s of bandwidth. That would make the 300MHz increase allow an additional 11 GB\s while allowing a lower voltage & wattage ouput.
Maximum ‘Single’ Efficient Core @ 4Ghz vs Stock (3.7Ghz) Results
In my initial Alder Lake-S Review I ran a benchmark to show the absolute max performance for a single P-Core and E-Core. I will be performing the same tests in this article, but at the moment we are focusing on the Efficient Core (E-Core). Using the same requirements in the previous article I will select the best Efficient Core based on the lowest latency during my deep-dive into the micro-architecture.

Above you can see that a single Efficient Core can complete approximately 3 extra gigabytes of data (3GB\s). So we can expect all 8 Efficient Cores to get near or exceed this number in specific circumstances. In the original review I hit 283GB\s for a single Efficient ‘Atom’ Core, but this time around with a 4GHz overclock I increased that number to 286 GB\s. The best case scenario was 433GB\s with the 4GHz overclock which is a 26 GB\s increase over my original stock (3.7GHz) results of only 407 GB\s.
All Efficient Cores @ 4Ghz vs Stock (3.7Ghz) Max Results
Now we will take a look at the absolute best case scenario for the Efficient Cores working together.

Going deeper into Alder Lake’s micro-architecture shows how quickly and how much data the cores can crunch. We see an increase of 365 GB\s pushing the overclocked Efficient ‘Atom’ Cores up to 2.79 TB\s (terabytes) a second. That is a respectable increase over the stock 2.42 TB\s which used higher voltage in my original Alder Lake-S Review article.
Efficient Cores @ 4Ghz Conclusion
Wrapping it all up shows some very impressive results. I managed to make the Efficient Cores more “efficient” by lowering the voltage for the entire CPU (1.17v) and by overclocking the E-Cores to 4GHz. The Efficient Cores (8 Atom Cores) temperature only averaged 54 Celsius. I believe there is more headroom in the E-Cores and I will explore this more in future articles when I receive my LGA1700 brackets for my CPU liquid cooler. Cinebench R23 shows a 523 point increase with lower CPU temps and power usage. Y-cruncher was able to crunch data 318 milliseconds quicker and the latency dropped even lower at the L3 and L2 cache's which should naturally allow for higher bandwidth and better throughput. To support that theory I ran several low level benchmarks to take a closer look at the 'Gracemont' micro-architecture. The Efficient Cores performed much better than expected with only a 300MHz increase across all tests. (Stock 3.7GHz vs Overclock 4.0GHz). The L3 Cache latency decreased from 14ns to 13ns with the 4GHz overclock while the L2 decreased by 4%. Remember that when it comes to latency lower is always better. All of the results so far are only using the CPU with 1.17v and DRR5-4800Mhz frequency. On the next page we will overclock the DDR5 RAM and see how far I can push Alder Lake with lower voltages (1.11v).
DDR5 OverclockingLatency and Performance Deep Dive
On the previous page I undervolted the CPU to 1.17v, but now all results will show the CPU using only 1.11v. The Efficient Cores will continue to run at 4GHz, but now with the DDR5 RAM overclocked. A few people have called me out for jumping on the DDR5 RAM train so early, but coming from DDR3 I had absolutely nothing to lose. I am not 100% sure what the safe voltages are for the DDR5 RAM so I am being conservative with the voltage and how far I push the frequencies. My stock DDR5 frequency is 4800Mhz (40-39-39-76). I kept the timings the same across all frequencies (40-39-39-76) and managed to overclock the DRAM to 5000Mhz, 5400Mhz & 5600Mhz. DDR5 4800Mhz, 5000Mhz and 5600Mhz are the main results that will be focusing on. This will show the performance scaling across multiple DDR5 frequencies. The goal is to lower the latency, undervolt the CPU, lower temperature, lower wattage, overclock the Efficient-Cores to 4.0GHz and from that point I will take another deep dive into the micro-architecture. I also included my results with the stock voltages and stock frequencies as well for comparisons. The ultimate goal remains the same and that is to make Intel’s 12th Gen Alder Lake as efficient as possible.
DDR5 Overclocking - Latency Deep Dive

The Latency Chart above shows 3 different results for the DDR5 4800Mhz, 5000Mhz and 5600Mhz becnhmarks. We see that the DRAM Bandwidth scales nearly perfectly with the theoretical DRAM bandwidth. From 4800Mhz to 5600Mhz I was able to increase my DRAM Bandwidth by 18% from 75.7 GB\s to 89.4 GB\s. The small datasets benchmarks show a decrease from 66.43ns to 57.07 ns which is a 14% decrease; and probably explains why everything feels “snappier” as I am navigating around the operating system. Most applications won’t use a ton of DRAM to be stored in memory, but this depends solely on your workloads and the types of apps you need to execute. Moving down to the larger datasets shows a very nice decrease of 75.40 ns to 68.45ns (lowest tests recorded showed 66.2ns) and that comes out to 9% on average. That is with the same default timings “40-39-39-76”. When the processor needs to access larger files in the DRAM we should see some sizable increases in performance. I will be testing this later in this article during my second round of benchmark testing and uarch deep-dive. Going deeper into the micro-architecture I decided to include the Performance Core Latency and the Efficient Core Latency. Instead of showing each individual core for both P & E Core for each DDR5 frequency, I decided to combine them in groups of two and show the overall latency average. Starting with the Performance Core Latency, the average of all individual P-cores came out to 59.10ns with DDR5-5600Mhz. That is a drop of 7.09ns which is a sizable drop for per core latency to DRAM. The Efficient Core Latency to DRAM only dropped by 3.55ns which is still a pretty good drop. In my first Alder Lake-S Review it was revealed that the Efficient Cores could access cache memory and DRAM much quicker than the Performance Cores. The lower voltage, 4Ghz overclock and DDR5 overclocked to 5600Mhz makes the Atom Cores even more efficient.
All 'undervolt (1.11v)' results below are using E-Cores @ 4GHz + DDR5-5600Mhz
DDR5 Overclocking – All P & E Cores Deep Dive

Earlier in this article we focused on Efficient Cores @ 4GHz since I did not overclock the Performance Cores. Now we will focus on both the Performance and Efficient Cores (4GHz) now that I have overclocked my DDR5 DRAM to 5600 MT\s. This benchmark shows all of the cores working together on various workloads. The Stock (1.27v) information comes from my initial Alder Lake-S Review. I have increased my total bandwidth by 27 GB\s.
DDR5 Overclocking – 8 Performance Cores
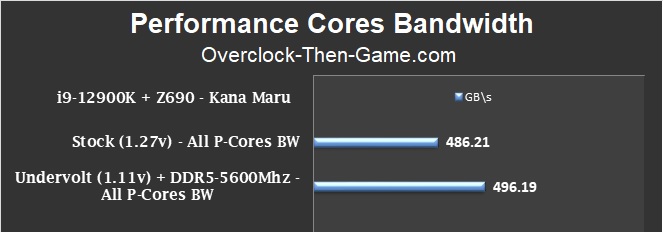
I have separated the Performance Core and Efficient Core results to show my performance increases with the DDR5-5600Mhz overclock. Above we see an increase of roughly 10 GB\s with all 8 Performance Cores working together. Alder Lake continues to impress me only 1.11v (vCore) being used during 100% CPU utilization.
DDR5 Overclocking – 8 Efficient Cores

Now we will take a look at both Efficient Clusters working together on the same workloads. Each Cluster contains 4 Atom Cores so this benchmark shows 8 Atom Cores working together. Stock voltages & stock frequencies (3.7GHz) showed 175.55 or 176 GB\s in my previous Alder Lake-S Review, under-voltage (1.11v) & overclocked frequencies (4GHz) shows 187.75 or 188 GB\s. That’s a very nice increase of 12 GB\s that was basically free. The Efficient Cores run very cool with one Cluster showing 4 E-Cores at 56c and the other Cluster showing 4 E-Cores at 52c. I hope that I can push the E-Cores to 5Ghz one day. It is also possible that the temperatures can be lower since I am still waiting on my LGA1700 brackets to be delivered for my AIO.
DDR5 Overclocking – Single Efficient Core MAX Performance
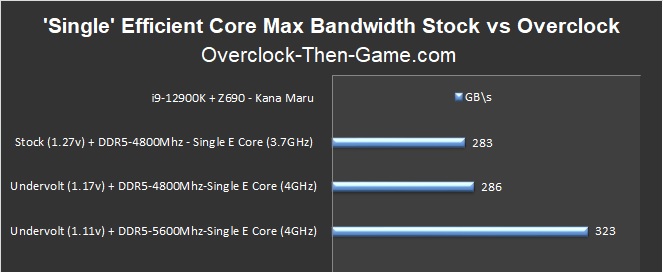
Time to go a little deeper and take a look at the absolute best case scenario’s for the Efficient Cores. I have selected the best ‘Gracemont’ Efficient Core to perform this test just as I did in my last article. This test will show the top performance for one Efficient Core. It is a “true” single core test that should tell me exactly how quickly and how much data the Efficient Core can compute. Earlier in this article I revealed the latency for each Efficient Core. We saw an improvement in latency at nearly every level. At the top of this page under the “DDR5 Overclocking - Latency Deep Dive” we saw the decrease of overall system latency and the Efficient Core Latency. With the E-Core frequency being overclocked to 4GHz, the DRAM being overclocked to 5600Mhz and latency being lower we see that a single Atom ‘Gracemont’ Core performance has increased by 14% over the stock settings. The chart also reveals a few more interesting details. Undervolting (1.17v + DDR5-4800Mhz) and overclocking (4GHz) shows a minor increase which is still great because it’s basically free performance, however, when overclocking the DDR5 to 5600Mhz we see a large increase in performance. The additional DRAM bandwidth and quicker access to that data allows the Efficient Cores to work more effectively. It is going to be interesting to see how much more performance is waiting within these Atom Cores.
DDR5 OverclockingSynthetic Benchmarks
Cinebench R23 - DDR5-5600Mhz
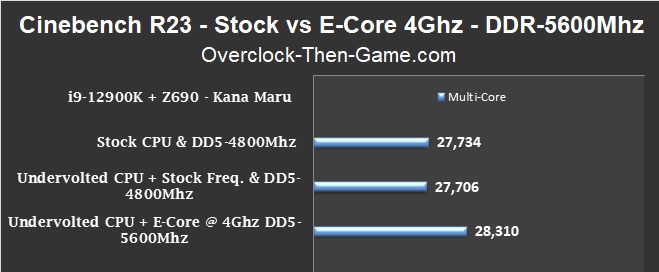
The stock CPU settings with DDR5-4800Mhz and the undervolted CPU with DDR5-4800Mhz shows that the results are within the margin of error (0.1%), so those result are fine. When I overclock the E-Cores to 4GHz and the DRAM to 5600Mhz I increased my score by 576 points.
7-Zip 19.00v - DDR5-5600Mhz
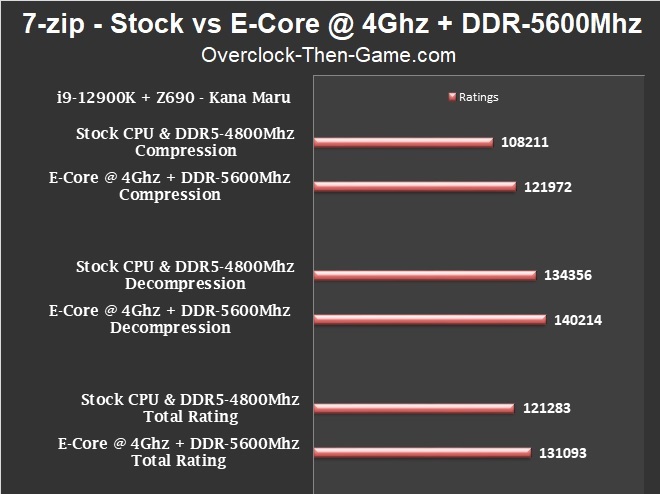
Similar to all of my previous benchmarks I have shown the stock settings vs the undervolted (1.11v) settings. The Compression test shows a 13% increase, the Decompression test shows a 4% increase and the Total Rating shows a 8% increase.
y-cruncher - DDR5-5600Mhz

I have decided to show all of my benchmark results so that everyone can see the performance scaling. There are 4 results for y-cruncher and they actually grouped into two pairs. The first pair shows the stock settings against the undervolted settings & E-Cores overclocked to 4GHz. Both of the first two benchmarks are running DDR5-4800Mhz. The second pair shows nearly the same settings above, but with the DDR5-5600Mhz frequency and CPU undervolted even further to 1.11v. Overclocking the E-Cores to 4GHz along with the DDR5-5600Mhz shows that the benchmark completes 2.02 seconds quicker over the stock settings (1.26v + DDR5-4800Mhz). That is roughly an 8 percent gain in performance while dropping the total system wattage by 93 watts.
CPU-z - DDR5-5600Mhz
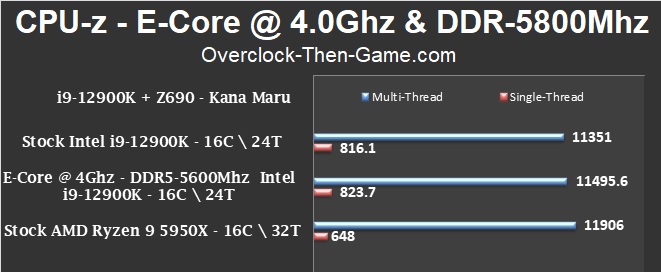
CPU-Z shows a slight increase as well which is fine since I am using much less voltage while increasing the overall performance. My multi-thread score increased by 145 points and the single-thread score increase by 8 points. CPU-Z includes CPU references and I decided to use the AMD Ryzen 5950X (16C \ 32T) as a comparison.
Conclusions & Comments
There was a lot of consider when deciding which platform would be my upgrade path. There were many options to choose from since my PC was much older than most PCs in the market. Competition and performance is also a great thing because this is better for consumers overall. Ultimately I decided on Alder Lake-S and the Z690 platform. So far the CPU has been nothing short of amazing. It appears that Intel has taken a step back and improved many things across the board. I’m happy to see a return to a more traditional type of overclocking\underclocking experience with the Z690 platform. Although tweaking many settings isn’t always the easiest thing to do, it can pay off to actually learn the platform and its features. This entire focus of this article was undervolting while lowering wattage and temperatures while keeping the same stock performance or near stock performance. Initially I was not expecting to overclock, but only planned to lower wattage. Instead I overclocked all the Efficient Cores to 4GHz, overclocked the DDR5 DRAM to 5600Mhz and undervolted my CPU vCore to 1.11v under full 100% load. The lowest CAS I could get with my DRAM was CAS: 34 with DDR5-5000Mhz. I decided to use DDR5-5600Mhz with CAS: 40 instead for the larger bandwidth increase as well as lower latencies. I will pursue more aggressive DRAM overclocks in the future when I begin to overclock the Alder Lake-S processor. My first goal was to make Alder Lake-S as efficient as possible while increasing my performance. I believe that I have achieved that goal. My CPU Package voltage decreased from the stock 224 watts to only 184 watts on average. The wattage from the wall outlet decreased from 368watts to only 275watts on average. That is a drop of 93 watts from the wall outlet while increasing performance across the entire platform. Lowering the vCore voltage (1.11v) also helped the CPU temperatures tremendously. I went from a high temperature of 79c with stock frequencies to only 66c along with overclocked Efficient Cores (4.0GHz). With the Performance Cores I settled for 4.9GHz under 100% load and 5.1GHz during light workloads. I decided to take another deep dive and show my actual performance increases at many different levels within the micro-architecture. I could have simply ran the typical synthetic benchmarks and released this article, but I decided to show the same type of deep-dive performance information as I did in my initial Alder-Lake-S article. This was done for two reasons, the first reason being that Alder Lake-S is Intel’s brand new desktop variant of their ‘Hybrid Technology’. The second reason being that current software has not begun to utilize Intel’s new micro-architecture with (big) Performance Cores and (LITTLE) Efficient ‘Atom’ Cores. To combat this Intel created their Intel Thread Director along with Microsoft with their Windows 11 scheduler (Thread Director also works to a certain extent in Windows 10). To add to the second reason I decided to perform my own personal benchmarks and skip past the software limitations as much as possible; and to extract as much information as I could. This would show that although not all software applications utilize Alder Lake-S micro-architecture properly, I could show the exact increases at the micro-architecture level. This would give a better representation and prove that although software might not always show big increases, it would show that the Alder Lake-S processor is actually performing better than what we could see. I included both lower-level deep dive information as well as high level synthetic benchmarks to show that I have achieved my goal. The Core i9-12900K is very impressive and appears to be very efficient. I believe there are still more ways to gain more performance with a low vCore settings. One way could be the Ring Bus and other various settings to tweak. I will continue to learn more about the platform, but I am taking it slow with Alder Lake since this is a completely different beast than my 1st Gen X58 beast. So far so good and with a little tweaking and testing you can save a lot of power while increasing performance. This is only my first week of tweaking several settings while underclocking and overclocking so stay tuned for future articles.
Thank you for reading my "Alder Lake Deep Dive - Making Alder Lake Efficient & DDR5 Overclocks" article Feel free to leave a comment below and feel free to share this article. If you would like to see more content like this please consider donating to my Patreon or PayPal by clicking the images below. Thank you.
